MLB Umpires Have Gotten Much Better At Calling Balls & Strikes

Image credit: (Photo by Matthew Grimes Jr./Atlanta Braves/Getty Images)
Last week, we wrote about how hitters, pitchers and fielders keep getting better at the major league level and provided a number of examples.
It turns out, the same is true with umpires when it comes to calling balls and strikes.
I know. I’ll pause for a minute. Let it out. I’m sure you’re stewing about some blown call against your favorite team that happened last night or a couple of games ago. It still happens.
Many of you are probably screaming for robot umpires at this moment. But if you look at the consistency of the strike zone, it’s remarkable how much things have changed in the past 18 seasons. Even as pitchers have gotten better and better at throwing high-octane pitches with baffling movement, the strike zone is much more consistent and the number of missed calls has dropped dramatically.
How A Strike Call Changes Over Time
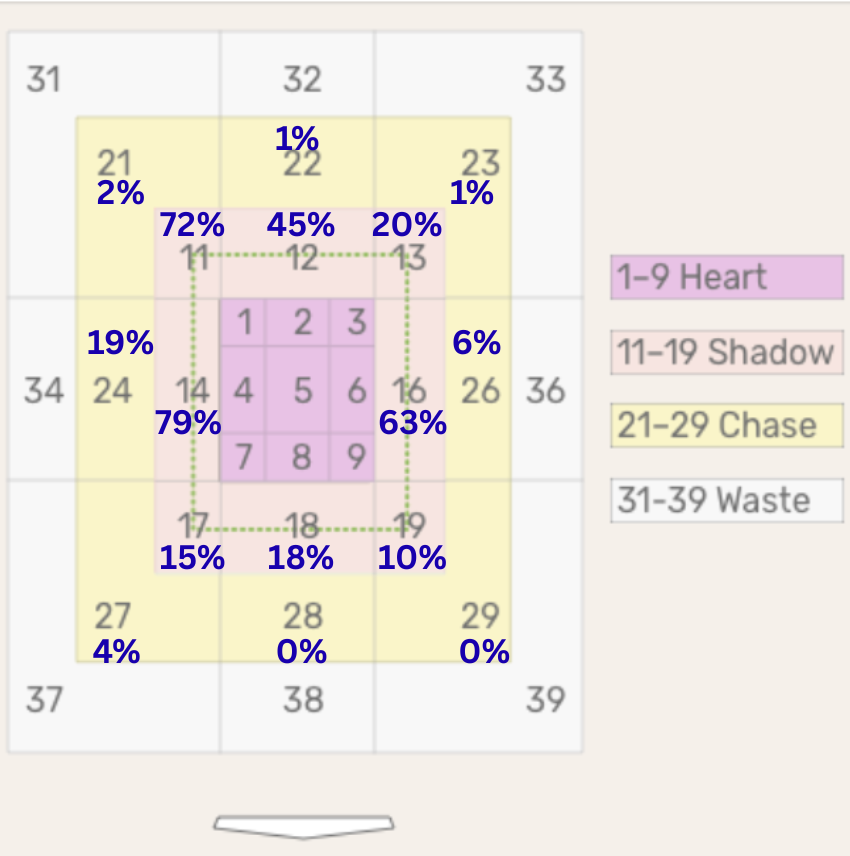
Let’s start with an example. Imagine there’s a lefty batter at the plate, and the pitcher has been nibbling, staying away, away, away. In a two-strike count, he puts the ball (the black dot) here:

Here’s a visual example of a pitch in that spot from the pitcher’s viewpoint:
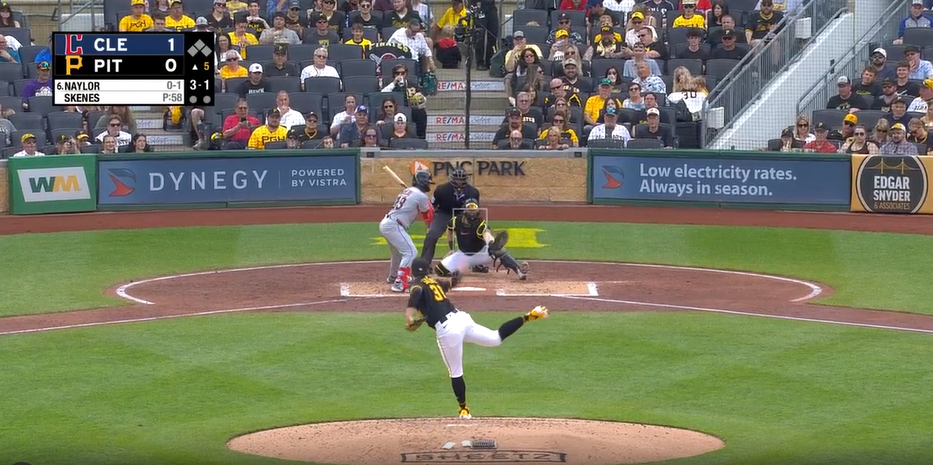
I think we can all agree that a pitch in this location is a ball. It’s well off the plate and can be almost into the righthanded hitter’s batter’s box by the time it gets to the catcher.
In 2008, this pitch was called a strike once out of almost every four times a lefty took it.
If you want an example of how umpiring has gotten much more consistent in recent years, zone 24 on the graphic above is where I go. That pitch has gone from being called a strike one out of every four times to one out of every 1,000. It’s happened six times all season. But back in 2009, there were over 4,000 strikes called on that pitch to lefty hitters.
That’s a remarkable difference. Here’s a closer look at the numbers on the pitch:
| year | Called STRIKE % | YEAR | Called STRIKE % |
|---|---|---|---|
| 2008 | 23.44% | 2017 | 3.09% |
| 2009 | 24.20% | 2018 | 2.71% |
| 2010 | 21.69% | 2019 | 2.10% |
| 2011 | 20.19% | 2020 | 1.86% |
| 2012 | 18.14% | 2021 | 1.45% |
| 2013 | 12.21% | 2022 | 1.25% |
| 2014 | 10.76% | 2023 | 0.61% |
| 2015 | 8.57% | 2024 | 0.63% |
| 2016 | 6.83% | 2025 | 0.11% |
The strike zone has gotten more vertical in recent years, as the edges of the zone in and out have been sanded down. But more than that, it’s just become more consistent.
Before we go any further, it is important to note that all of this data is gathered from MLB pitch data at BaseballSavant.com. Since 2008’s arrival of PitchFX with Trackman doppler radar data and on through the adoption of Statcast with Hawkeye optical tracking, every pitch is plotted at the plate and categorized by numerical zone, as the top graphic illustrates. To do this research, we downloaded the data on all taken pitches and whether they were called a ball or a strike for all 36 separate attack zones.
Calls In The Shadow Zone
Ok, let’s move in a bit from zone 24 to the “shadow zone.”
This is the area right around the plate on the very edges of it at the top, bottom and sides of the zone. Pitches located here are in a gray area where taken pitches are sometimes called strikes and sometimes called balls. If you are a strict about your rule book, you may argue that anything outside of the “heart” of the zone should be called a ball, but the shadow zone has always been the area where hitters and pitchers know that pitches could be called either way.
From 2008 (the start of pitch tracking data) to now, pitches in the shadow zone have generally hovered around a 50% called strike rate.
Over that period, that 11-14-17 area on the inner edge of the zone for righthanded hitters has always been a coin-flip area for called strikes. In 2008, pitches there against righties were called strikes 46.3% of the time. That number has slowly dipped to 39.4% of the time this year. It was 41.1% last year. As we noted before, the zone has narrowed on the edges.
But that exact same spot against a lefthanded hitter used to be a strike more often than not. In 2008, pitches in that area were called strikes 61.3% of the time against lefties. It stayed above 60% until the 2016 season. It dipped to a 50-50 coin flip in 2021. Now, it’s 39.6% of the time—right in line with how that pitch is called against a righthanded hitter.
It used to be that pitchers could edge the zone out further and further against lefties. Now, the zone stays tied to home plate.
There was a similar issue on the other side of the plate—away from righthanded hitters and in on lefties—but the percentages were different. In 2008, 48.4% of pitches in the 13-16-19 zones were called strikes against righthanded hitters, but only 28% of the time was that a called strike against a lefty. The percentage of strike calls in that zone against lefties has actually gone up to 34.3% in 2025 (it was 37.5% last year). But for righties, it’s stayed relatively static. This year it’s 45.4% of the time, but it was 50.5% last year.
A Narrowing Zone
So, the strike zone has gotten narrower and more consistent. It’s also gotten vertically larger, mainly because umpires now call low strikes in the zone.
Zones 7-8-9 are the bottom third of the heart of the strike zone. These are viewed as pitches within the zone, inside that shadow zone we talked about before.
But in 2008-2009, pitchers only had an 80% shot of getting a pitch called a strike in that bottom third of the zone, even though that is defined as clearly a strike. As umpiring has improved, and as MLB teams have worked with catchers to get them to better present low pitches—one-knee catching also helps umpires get a better view—that strike rate has climbed steadily. Nowadays, 99% of pitches in the lower third of the zone are called strikes.
Overall, the zone has gotten narrower over the past 18 seasons. It’s also gotten a bit deeper, as pitches at the bottom of the strike zone and in the shadow zone beneath the strike zone are more often called strikes nowadays.
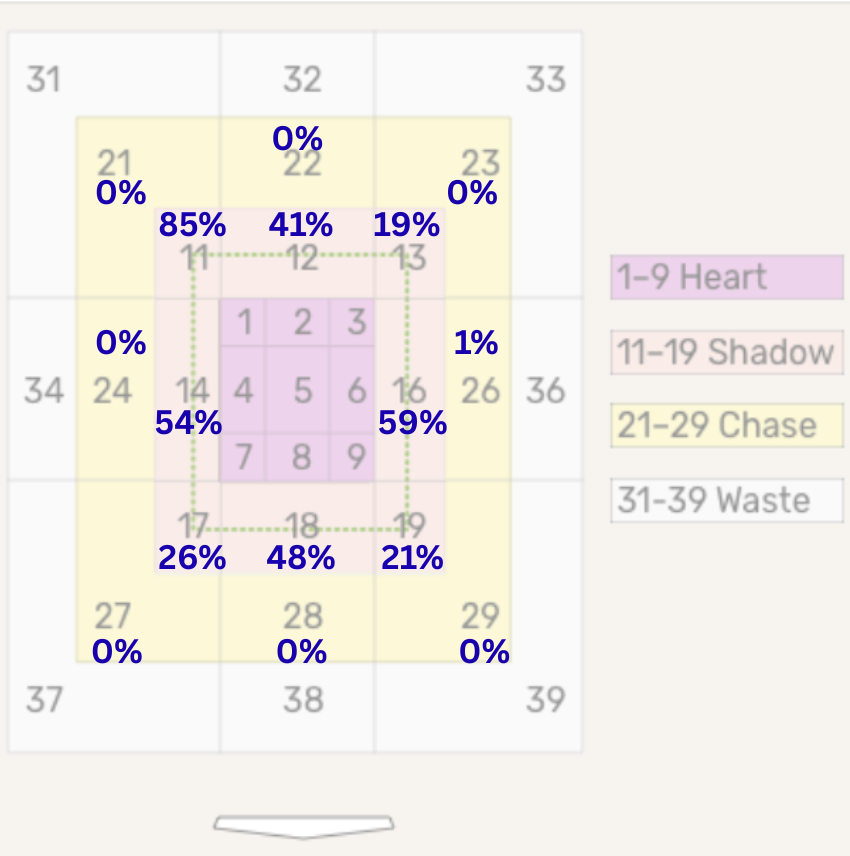
To illustrate this, let’s compare the strike zone charts from 2008 and 2025. Here’s the percentage of called strikes in each shadow and chase zone in 2008:
And here’s the same graphic for called strikes in 2025. As you can see, the called strikes in the chase zone have largely disappeared, and the calls in the shadow zone have moved:
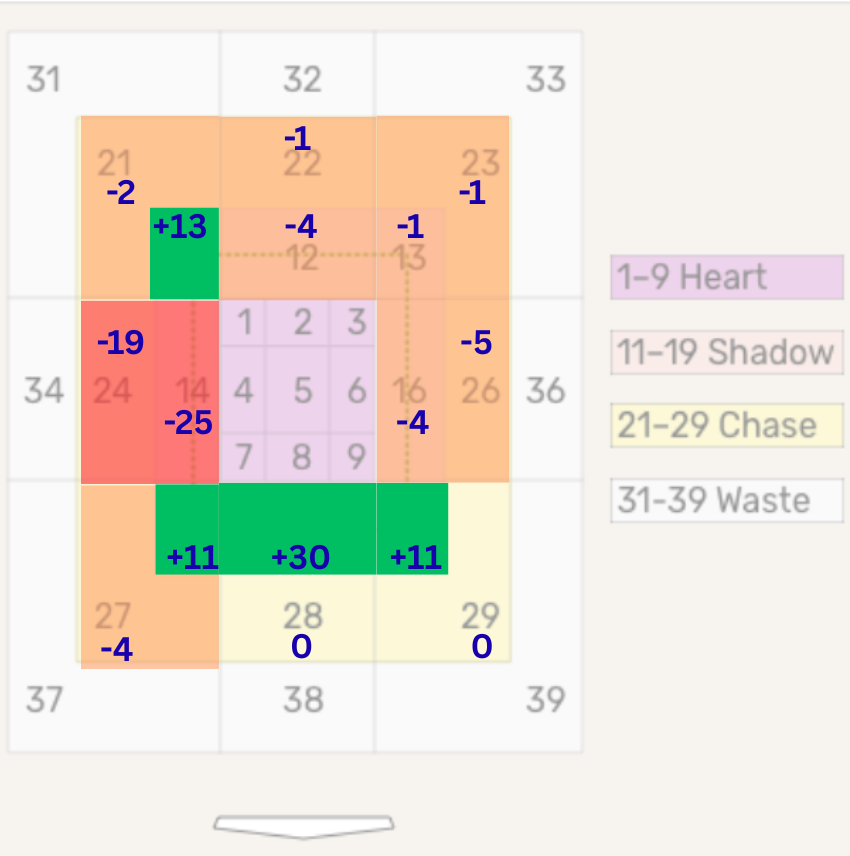
For a better look at the changes, here’s the change in percentage points for each zone from 2008 to 2025. There are many more called strikes at the bottom of the zone, but fewer called strikes on the edges of the plate.
But the changes aren’t just on the edges.
In 2008, a taken pitch in the heart of the zone was called a strike 92.4% of the time. It has steadily edged upward since then to the point where this year, those pitches are called strikes 99.3% of the time. Calling a pitch located in the heart of the plate a strike would seem elemental to umpiring a baseball game, but as the numbers show, it’s been a work in progress.
Here’s the called-strike rate by zone for each of the past 18 seasons. They show that the zone that should always be called strikes (heart) and always should be called balls (chase/waste) have steadily edged toward that reality:
| Year | heart | Shadow | Chase | Waste |
|---|---|---|---|---|
| 2008 | 92.4% | 46.1% | 5.8% | 0.1% |
| 2009 | 94.2% | 46.5% | 5.4% | 0.1% |
| 2010 | 96.1% | 48.2% | 4.5% | 0.0% |
| 2011 | 95.9% | 46.9% | 4.4% | 0.0% |
| 2012 | 96.8% | 47.9% | 3.9% | 0.0% |
| 2013 | 97.4% | 48.8% | 2.9% | 0.0% |
| 2014 | 97.8% | 50.2% | 2.5% | 0.0% |
| 2015 | 98.0% | 50.1% | 2.0% | 0.0% |
| 2016 | 97.8% | 49.5% | 1.7% | 0.0% |
| 2017 | 98.0% | 51.0% | 1.0% | 0.0% |
| 2018 | 98.6% | 51.5% | 0.7% | 0.0% |
| 2019 | 98.9% | 52.4% | 0.7% | 0.0% |
| 2020 | 98.9% | 52.7% | 1.1% | 0.0% |
| 2021 | 99.2% | 52.0% | 0.5% | 0.0% |
| 2022 | 99.3% | 51.2% | 0.5% | 0.0% |
| 2023 | 99.3% | 50.5% | 0.4% | 0.0% |
| 2024 | 99.3% | 50.8% | 0.3% | 0.0% |
| 2025 | 99.2% | 47.3% | 0.2% | 0.0% |
So, the next time you get frustrated by a bad call on a pitch, try to remember that the umpires are much more consistent now than they were just a few years ago.